

Finding Causative Mutations With A Candidate SNP Approach
Pre-Processing Sequence Data
Learning Objectives
- Understanding Fastq
- Inspecting and interpreting the quality of sequence data with FASTQC
- Cleaning out sequence data with trimmomatic.
Fastq is a typical sequence format generated by HTS machines. It contains four lines, a sequence ID, the sequence, the ID again and a messy looking quality string made up of characters, each of which represents the quality of the base above it. Here’s an example:
 @SEQ_ID
 GATTTGGGGTTCAAAGCAGTATCGATCAAATAGTAAATCCATTTGTTCAACTCACAGTTT
 +SEQ_ID
 !''*((((***+))%%%++)(%%%%).1***-+*''))**55CCF>>>>>>CCCCCCC65
Each of the weird characters represents a number according to the ASCII look up table, where numbers are linked to characters, so ! means 33 and " means 34. These numbers are generally Phred scores, which encode the likelihood of the base being wrong on a log scale.
We can use this quality information to assess how well our sequencing went. Along with sequence quality information we should also assess the composition of the sequence data. A program called FastQC is useful for this.
FastQC presents a range of plots and summary statistics, you need to provide it with Fastq data.
A typical output is like this:
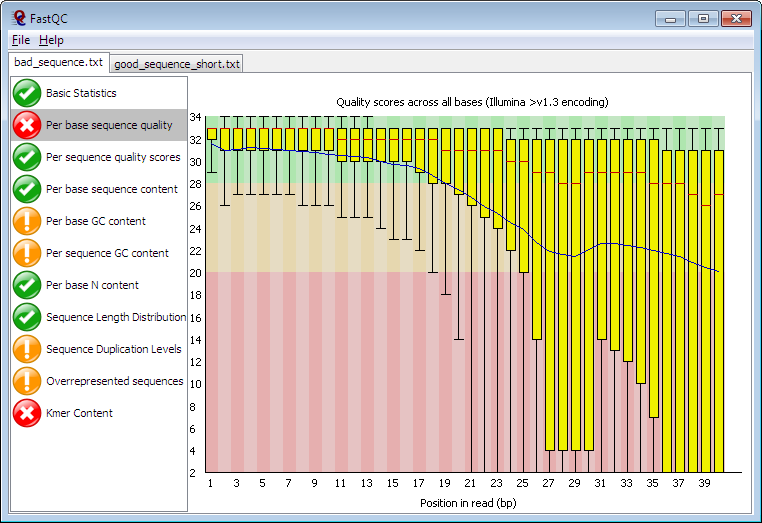
FastQC Summary Plot
This is the per base sequence quality. The plot shows along the x-axis the position in the read and for each position in the reads it shows a box-plot of all the quality scores at that position.
Noticeably in this figure, the box plots to the left have much higher and tightly grouped quality scores than those on the right. This is typical of Illumina machine sequence, the quality decreases the further you get along the read. As you can infer from the red region of the plot background, Phred scores less than 20 are generally not trusted.
We may (or may not) decide that we need to get rid of the lower quality sequence.
At the individual sequence read level, we can discard entire sequences if part is too poor or trim the read leaving the good part alone. One system for doing this is Trimmomatic which can perform a variety of trimming operations on sequence reads. It can remove parts of reads from the left or right sides up to quality thresholds - it uses a sliding window average, rather than just a harsh cut-off.
At the sequence sample level (e.g, the read file level), we may discover that our read set is not good. Reports from FastQC like the kmer content plot can show sequence problems, in this graph there is an over-representation of particular kmers at the start of the sequence that shouldn’t be there.
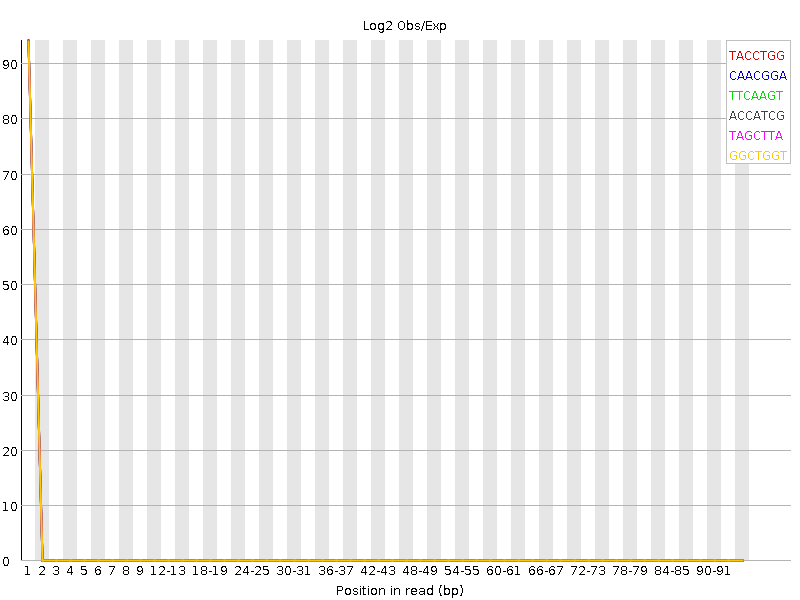
The first few bases here are significantly enriched, this can be due to sequence adapters (if they were used) but if not, then the sequence is likely not good, even if the quality scores are fine
1. Run FastQC
Use the reads in the QC Shared Data library. You will find the FastQC tool in the tool list under HTS QC. The reads are single ended from a mutagenised Arabidopsis thaliana (a model plant). They are Illumina Whole Genome Shotgun reads so don’t have any multiplex adapters and the plants are grown in sterile culture so we aren’t expecting contamination.
- How many reads are you using?
- What sort of output files do you get from FastQC?
- What should you do with these files? Do they represent a scientific control that could be published?
2. Interpret Sequence Quality
- Is there any evidence of contamination? Which report tells you?
- If there is, which sequence is contaminating?
- Which of the four files is the best?
3. Clean Up Poor Quality Sequence
Use the Trimmomatic tool in HTS QC. Select an appropriate Average quality required
- Find a trimming strategy to get rid of contamination you observed in section
2.1? - Which trimming strategy improves the low quality reads
- Did it make any difference?
- How could you filter on size? If you needed to pass only good quality, full length sequences to the next step?